Cost Segregation Study
Cost Segregation Study case studies show actual savings realized by O’Connor clients
O’Connor has performed thousands of IRS cost segregation studies on commercial property assets nationwide and abroad. Following are representative cost segregation studies of various asset types, with typical results.

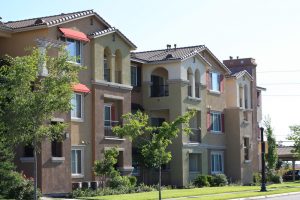
Case #1 Garden Apartment
A typical garden apartment asset in a major Texas metropolitan area, constructed in the early 1980’s, with 225 units and surface parking.
Improvement basis for the asset is $8,250,000. The study included two years of catch-up depreciation.
| Year of Purchase | Year of Study | 1st Year Additional Depreciation | 1st Year Tax Savings | Initial 5 Years |
| 2013 | 2015 | $1,536,853 | $608,594 | $774,974 |
Case #2 Hospitality
A typical hospitality asset in a major Arizona metropolitan area, constructed in the mid 2000’s, with 90 rooms and surface parking. Improvement basis for this asset is $6,800,000.
| Year of Purchase | Year of Study | 1st Year Additional Depreciation | 1st Year Tax Savings | Initial 5 Years |
| 2015 | 2015 | $386,824 | $153,182 | $719,294 |

Case #3 Office Building
A typical low-rise office building in a major Massachusetts metropolitan area, constructed in the mid 1980’s, with a total building area of 98,000 square feet. Improvement basis for this asset is $1,600,000.
| Year of Purchase | Year of Study | 1st Year Additional Depreciation | 1st Year Tax Savings | Initial 5 Years |
| 2016 | 2016 | $51,442 | $20,371 | $109,934 |
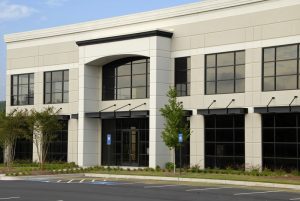
Case #4 Industrial / Office Warehouse
A typical industrial /office warehouse facility in Colorado, constructed in the mid 1980’s, with a total building area of 30,000 square feet. Improvement basis for this asset is $2,500,000.
| Year of Purchase | Year of Study | 1st Year Additional Depreciation | 1st Year Tax Savings | Initial 5 Years |
| 2016 | 2016 | $86,856 | $34,395 | $189,746 |
Case #5 Shopping Center
A typical neighborhood shopping center in North Carolina, constructed in the late 1980’s, with a total building area of 100,000 square feet. Improvement basis for this asset is $19,000,000. Note that this was a fourth quarter purchase, so the mid-quarter depreciation methodology was utilized.
| Year of Purchase | Year of Study | 1st Year Additional Depreciation | 1st Year Tax Savings | Initial 5 Years |
| 2015 | 2015 | $242,326 | $95,961 | $1,651,836 |
