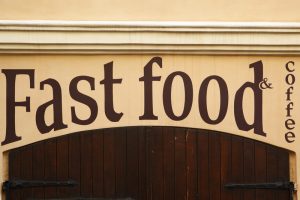
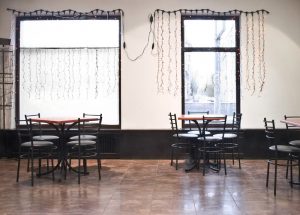
Fast Food Facilities
Cost Segregation Studies
 Fast Food assets typically offer a short life components mix a bit skewed towards 15 year depreciation life assts. Our cost segregation studies consider the service counter, dining area and food preparation area within the building, making sure we focus beyond the standard short life components to pick up food service specific items such as walk in reefers, special electric and/or gas sectors as well as the special HVAC involved in exhaust hoods.
 Significant opportunities are found on the exterior in the lighted parking areas and drive-through lanes. Our studies also break out the IRS mandated Units of Property when considering the long-term components present in your building.
 Our fast food cost segregation studies typically pay back the cost of the study in the range of 2 to 1 up to roughly 15 to 1 in the first year of study use. Note the actual results highlighted in the table below. First year savings range from about $7,000 up to roughly $30,000 for a more expensive asset!
Sample of Actual Study Results
Depreciable Basis
$2,150,000
$714,706
$5,476,716
$1,623,500
$1,318,776
Purchase Date
10/1/2015
1/1/2012
12/1/2015
2/1/2011
11/1/2015
Year of Study
2015
2012
2015
2011
2015
1st Year Additional Depreciation
$18,840
$78,127
$100,339
$62,613
$16,434
1st Year Tax Savings
$7,461
$33,595
$39,734
$26,924
$6,508
Year 1 Payback
1.2:1
12.4:1
9.1:1
10.5:1
2.4:1
Initial 5 Years Tax Savings
$136,055
$148,911
$653,681
$135,187
$109,941
5 Year Payback
23.7:1
56.0:1
151.0:1
53.7:1
41.6:1
* Results from studies using mid-quarter depreciation convention due to timing of purchase and other factors.
NOTE: The above listed tax savings are based on a 39.6% tax rate for the owner.
